

Infrastructure & Economic Development
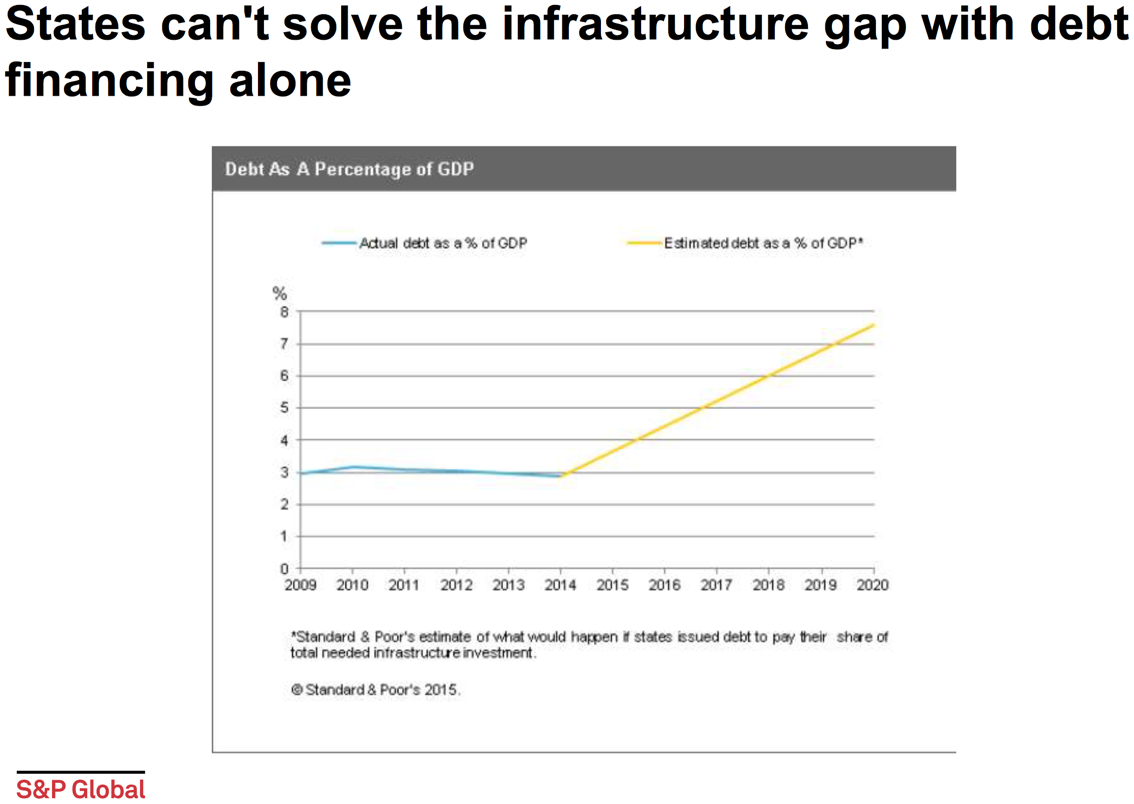
“The United States has the potential to become the largest P3 market in the world, given the sheer size of its infrastructure...Two inter-related trends
are at work that could cause P3 activity to expand: the need to upgrade,
replace or build out essential infrastructure assets and the inability of governments to finance these current and future infrastructure
investments entirely on their balance sheets.”
-Moody’s Investors Service
McKinsey estimates that $57 trillion of infrastructure investment is needed by 2030 to support economic growth expectations, worldwide. A big chunk, $23.8 trillion, will be for transportation-related projects: roads ($16.6 trillion), rails ($4.5 trillion), seaports ($0.7 trillion) and airports ($2 trillion).
The situation in the U.S. is no different: Investing in American Infrastructure is not an option, is a necessity! This is the take away of the 9th North American Infrastructure Leadership Forum, held in San Francisco in October 2017, with 500+ executives gathered to discuss infrastructure development in the U.S., Canada, and Mexico, while facilitating business and promoting projects across the region. Funding Infrastructure requires engaging private equity and innovative funding mechanisms in all relevant sectors, i.e. Roads, Bridges, Rail & Mass Transit, Airports, Waterways & Ports, Free Trade Zones and Inland Ports, Water & Wastewater, Electricity, Oil & Gas, Renewable Energy, Energy Transmission & Distribution Networks, Broadband, Data-Centers & Satellite Networks, Social & Welfare Assets (including Affordable Housing), Health Assets, Education & Community Assets.
As Fortress Investment Group has noted publicly, an estimated $3.6 trillion will be required to repair existing infrastructure in the U.S.. Much of that represents roads ($1.73 trillion) plus airports ($135 billion) and rails ($100 billion). On top of that, all the real estate projects and constructions, are ancillary and instrumental to new infrastructure investments. Donald Trump’s administration pledge to spend $1 trillion on America’s aging infrastructure over the next 10 years has drawn significant attention. North America is the most favored destination for infrastructure investment over the coming year, representing 60% of the industry believing it presents compelling investment opportunities.

Historically, the U.S. has largely used municipal bond financing to fund the country’s transportation, water, social, and airport infrastructure. Tax- exempt municipal bonds have financed more than $2 trillion in new infrastructure investments over the past 10 years. Such funding has been used to construct and finance repairs to transportation projects, social infrastructure (such as schools, hospitals, prisons, housing, and court buildings), publicly owned electric power, water, and natural gas assets, and other projects.

Over 50,000 state and local governments, authorities, and nonprofits have used municipal bonds. Nearly 75% of all public infrastructure financing comes from tax-exempt bonds. The remainder comes primarily from bank and private placement financings.

Investors are well aware of that need and their ability to step in where governments can’t. Market analysts estimate that private-equity firms alone will invest at least $100 billion in the next five to seven years on transportation. Likewise, Foreign Direct Investments have also significantly increased in infrastructure industries. The scale of the necessary resources, even allowing for a significant increase in public and domestic private investment, requires a much larger contribution by Multinational Enterprises (MNEs) in infrastructure FDI, such as power, telecommunications, transport and water, education and health.

According to PREQIN’s INVESTOR OUTLOOK: INFRASTRUCTURE ASSETS, H1 2017 Report, “The number of investors in the asset class has increased by more than 116% since 2013,” and the path is expected to grow.” “With the majority (63%) of investors under- allocated to infrastructure in January 2017, the asset class is likely to see a continuation of strong fundraising figures and upward pressure on asset prices, particularly if interest rates remain low”.

“Investor satisfaction with infrastructure has reached a three-year high: 89% of investors interviewed in June 2017 have either a positive or neutral view of the asset class, and 94% feel that their infrastructure investments in the past year have met or exceeded expectations. Investors continue to see strong risk- adjusted returns from their portfolios and remain committed to the asset class, with over half (53%) planning to commit more capital to infrastructure investments in the next 12 months than in the past year.”. “With a limited supply of investable assets, competition has increased resulting in asset prices climbing higher – 59% of investors identified valuations as a key issue for the infrastructure asset class. This is having an effect on the number of opportunities available to fund managers, with half of investors surveyed citing deal ow as a key issue. A further 60% of investors feel that asset prices are expensive, and two-fifths are finding it harder to find attractive investment opportunities compared to a year ago. Despite these concerns, investor appetite is strong: almost all (96% of ) respondents plan to maintain or increase their allocation to the asset class over the longer term, with half of investors looking to make three or more investments in the next 12 months”.
The infrastructure asset class has seen strong performance, consistently generating median net IRRs around the 10% mark since 2004. More specifically Infrastructure Assets delivered a Total Return of 35.38% in both 2016 and 2017, and Data Centers Assets 28.43%. It is therefore unsurprising that the clear majority (94%) of institutional investors feel that their infrastructure investments have met or exceeded their expectations over the past 12 months, an increase from both 2015 (77%) and 2016 (89%). Over the longer term, 21% of respondents feel their investments have exceeded expectations over the past three years, with only 12% of investors reporting that their infrastructure investments have fallen short of expectations.
“The increase in competition for assets – driven by increased participation in the asset class from fund managers with large amounts of dry powder to deploy and institutional investors seeking direct investment – is putting pressure on valuations. Sixty percent of investors surveyed believe infrastructure asset prices are expensive, including 11% that believe assets are very expensive. Correspondingly, deal flow is the second biggest concern on investors’ minds, with high valuations restricting the pipeline of available investments”.

Two- thirds of institutional investors expect their infrastructure portfolios to perform about the same in the next 12 months as in the past 12 months.
PREQIN’s INVESTOR OUTLOOK: INFRASTRUCTURE ASSETS, H2 2017 Report continues highlighting the following data:
- The proportion of institutional investors looking to commit more capital to the infrastructure asset class has increased significantly: over half (53%) of investors are planning to invest more in the next 12 months, an increase of 15 percentage points from results seen in December 2016 (Fig. 6.9).
- Over the longer term, institutions plan to remain committed to the infrastructure asset class, with half of respondents looking to increase their exposure and a further 46% planning to maintain their allocation to the asset class (Fig. 6.10). The fact that only 4% are likely to reduce allocations in the long term is indicative of investors’ confidence in the asset class to perform portfolio objectives.

- Data on unlisted fund searches and mandates issued by institutional investors on Preqin’s Infrastructure Online shows that investors are favoring fewer commitments in the year ahead, with half of active investors targeting just one or two investments. While just over half (51%) of active investors will commit smaller sums of less than $100 million, there remains a significant proportion seeking to commit more than $100 million to infrastructure funds in the year ahead, including 12% that plan to invest $350 million or more (Fig. 6.11).
- Institutional infrastructure investors are also looking for alternatives to the primary fund commitment model to gain exposure to the asset class.

- Demand for energy is rising globally, and investor appetite for the sector is growing: 37% of investors identify conventional energy sources as offering the best opportunities, closely followed by 33% that see renewable energy as the most attractive strategy (Fig. 6.13). This is a reversal of the results seen at the end of 2016, when 64% identified renewables as the best option and 43% thought the same of conventional energy. Despite 35% of investors reporting that core funds still present the best opportunities in the market (Fig. 6.14), the proportion of respondents favoring this strategy has fallen by 11 percentage points since the end of 2016, potentially due to the effect that growing demand has had on pricing.

- Furthermore, the proportion of respondents identifying opportunistic funds as the most attractive has more than halved from 42% in December 2016 to 17% in June 2017. When considering project stages, 44% of respondents believe greenfield offers the best opportunities at present (Fig. 6.15). There has been no real change in investors’ opinion of the most attractive markets since the end of 2016. As shown in Fig. 6.16, North America remains the favored destination for infrastructure investment, perhaps linked to the current US administration’s plans to invest $1 Trillion in infrastructure assets across the country.

Unlisted funds remain the preferred route to market for the vast majority of active investors in the next 12 months (Fig. 10). A greater proportion of Asia- and Europe-based investors will favor direct investment than investors based in North America, like North America-based investor. In terms of capital allocation, a greater proportion (19%) of investors plan to commit $500 million or more to infrastructure in the next 12 months than at the same time last year.


C&Z GLOBAL Advisors is ideally positioned to capitalize upon “the Renaissance of American Infrastructure” and the positive outlook investors’ demand for infrastructural assets in the international market place, based on its Leadership’s rare focus, experience, and footprint, developed throughout three decades of national and international work.
C&Z GLOBAL Advisors can accordingly provide to national and international investors outstanding expertise, transactional record and unique access to the public sector, at Federal and State level to identify -internationally and throughout North America, and, particularly in America’s Top States for Business that have proven robust economic growth- and structure infrastructural projects and infrastructural real estate investments, and related funding options, in all relevant infrastructure sectors, assisting its clients on a on a project by project basis, or through the establishment and management of specialized routes to market, such infrastructure funds, alternative investment vehicles, or specialized infrastructure private equity funds (see our SERVICES).
Forward-Looking Statements: This Website may contain forward-looking statements, as regards various industry clusters, or the Infrastructure and Commercial Real Estate sectors and projects. Forward-looking statements are statements that are not historical facts; they include statements about beliefs and expectations and the assumptions underlying them. These statements are based on plans, estimates and projections as they are currently available to the management of sources we have cited herein, and are not guarantees of future performance and involve certain risks, uncertainties and assumptions that are difficult to predict with regard to timing, extent, likelihood and degree of occurrence. C&Z GLOBAL Advisors undertakes no obligation as to the merit and correctness of the same, and/or to update publicly or privately any of them in light of new information or future events. Furthermore, C&Z GLOBAL undertakes no obligation to update, amend or clarify forward-looking statements, whether as a result of new information, future events or otherwise. By their very nature, forward-looking statements involve risks and uncertainties. A number of important factors could therefore cause actual results to differ materially from those contained in any forward-looking statement. Such factors include the conditions in the financial markets internationally and in the United States, the development of asset prices and market volatility. Furthermore, past performance is not indicative of future result.